The parliamentary election season is on and you are bombarded with rhetoric, promises and manifestos from all sides of the political field. As the routine of a five-year ritual, this election season too, parties and candidates make bombastic claims about all they have achieved in their respective constituencies. But, what really are the facts on ground? Did so and so MP form such and such a constituency, who has been elected three times in a row – set up public schools and hospitals and build roads in his constituency? Did he do anything at all to improve livelihoods of the people in his constituency?
Here is a tool that helps you check some facts about your constituency – may be go some way in helping the voter in you to make an informed decision. FACTCHECKER in collaboration with IndiaSpend and NewsClick brings you Constituency Check, a tool that maps various socio-economic indicators of individual parliamentary constituencies on to an interactive map.
What are the pressing issues in your constituency and your region? – after all when we vote, we vote on issues that matter to us.
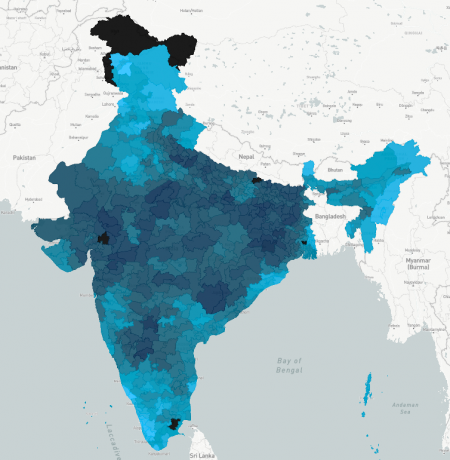
Are the health care costs too high? May be your constituency needs more public hospitals? You can check this by going to this map. Click on the Demographic and Economic Indicators box on the left side of the map, and chose any indicator on health expenditure from the drop down on the top right. You can click on cost of hospitalization or out of pocket expenditure on health. Hover over the constituency of choice in the displayed India map and you will see all the relevant facts on the right side.
AVERAGE EXPENDITURE PER HOSPITALISATION (RURAL)

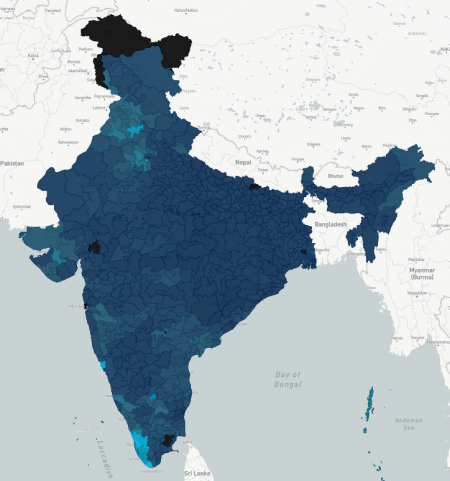
Are the children in your region getting enough food and growing well or should something be done about it? May be the mid-day meal scheme needs to be implemented better? May be there should be more Aanganwadis in the villages of that area? You can click on the Health Indicators box on the left side of the map and chose an indicator from the drop down – be it underweight among children or infant mortality or another indicator.
UNDERWEIGHT AMONG CHILDREN (UNDER 5)

Are the family incomes too low in your area? May be the region needs public projects and employment schemes to ensure better livelihoods? Click on the Demographic-Economic Indicators box and chose the per capita monthly expenditure, which is used as a proxy for monthly incomes, from the drop down.
MONTHLY PER CAPITA EXPENDITURE (RURAL)

There are many such indictors you can visualise on the Constituency Check map, which will give you some idea of the developmental situation in the constituency. All these indicators are taken from various publicly accessible data repositories and statistical agencies like NFHS and NSSO. The methodology by which data from these various sources is converted into constituency level indicators – by Factchecker-IndiaSpend-NewsClick team – can also be read here. You just have to click on the ‘About’ box.


